


CausalPy — Open-Source Bayesian Causal Inference for Python#
Research-grade causal inference workflows for quasi-experimental designs.
CausalPy helps you estimate causal effects with transparent assumptions, uncertainty-aware modeling, and reproducible outputs:
Quasi-experimental methods: Difference-in-differences, synthetic control, regression discontinuity, interrupted time series, instrumental variables, and more
Bayesian-first estimation via PyMC with full uncertainty quantification, plus traditional OLS via scikit-learn
Decision-ready outputs: Effect summaries with credible intervals (HDI), practical significance (ROPE), and publication-quality plots
📞 Book a consulting call#
CausalPy is built and maintained by PyMC Labs. If your team is exploring a consulting engagement for lift testing, complex or high-stakes causal work, you can book an introductory call. These calls are for consulting inquiries only. For technical usage questions and free community support, please use GitHub Discussions and the documentation below.
Help and documentation#
Ask usage questions in GitHub Discussions Q&A so the issue tracker stays focused on bugs and enhancements.
Report bugs and feature requests in Issues
Browse detailed guides in the documentation
Installation#
To get the latest release:
pip install CausalPy
or via conda:
conda install causalpy -c conda-forge
Alternatively, if you want the very latest version of the package you can install from GitHub:
pip install git+https://github.com/pymc-labs/CausalPy.git
AI Agent Skills#
CausalPy includes agent skills that teach AI coding assistants how to use the library for causal inference. Skills are available via Decision AI Hub and live in causalpy/skills/ in the source tree.
Quickstart#
import causalpy as cp
import matplotlib.pyplot as plt

# Import and process data
df = (
    cp.load_data("drinking")
    .rename(columns={"agecell": "age"})
    .assign(treated=lambda df_: df_.age > 21)
)

# Run the analysis
result = cp.RegressionDiscontinuity(
    df,
    formula="all ~ 1 + age + treated",
    running_variable_name="age",
    model=cp.pymc_models.LinearRegression(),
    treatment_threshold=21,
)

# Visualize the causal effect at the threshold
fig, ax = result.plot()

# Get a results summary with posterior estimates
result.summary()
The result.plot() visualizes the regression discontinuity design, showing the estimated jump at the treatment threshold. The result.summary() prints posterior estimates of the causal effect with uncertainty intervals.
Videos#
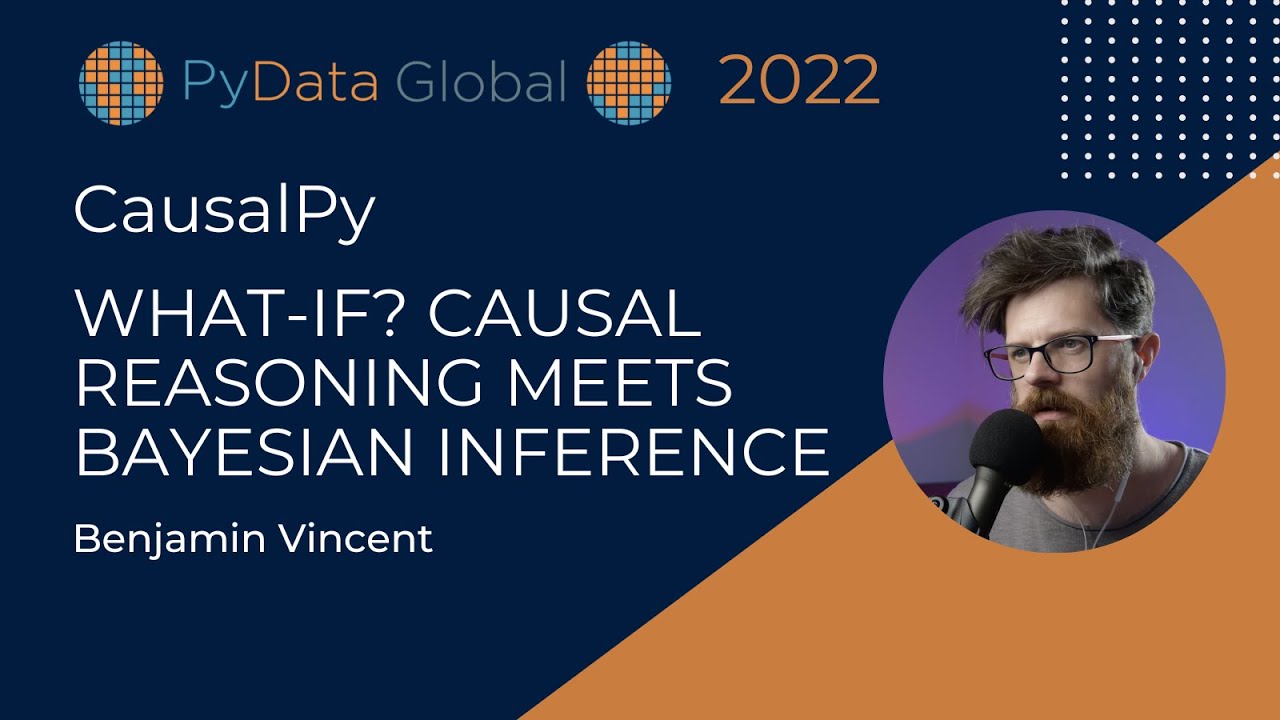
Click on the thumbnail below to watch a video about CausalPy on YouTube.
When CausalPy is a good fit#
You have a plausible quasi-experimental design (threshold rule, policy change, staggered rollout, geo lift, etc.)
You want uncertainty-aware estimates and diagnostics, not only point estimates
You need reproducible analysis artifacts for review and communication
When CausalPy is not a fit#
You need causal discovery from weakly identified observational data
You want fully automated “black box” causal answers without specifying assumptions
You primarily need production workflow tooling (pipelines, governance, multi-user collaboration)
Methods and Workflows#
CausalPy provides methods for common causal inference decision contexts:
Decision context |
Methods |
|---|---|
Focussed testing on certain units (geos, products) |
Synthetic control, Geographical lift |
Evaluate before/after changes, launches, policy changes |
Differences in Differences, Staggered DiD, Interrupted time series |
Exploit cutoff rules, score-based eligibility (credit, age) |
Regression discontinuity, Regression kink |
Can’t randomize, correct for selection |
Instrumental variables, Inverse propensity weighting |
Group differences, control for covariates |
ANCOVA |
Available methods#
Method |
Description |
|---|---|
Synthetic control |
Constructs a synthetic version of the treatment group from a weighted combination of control units. Used for causal inference in comparative case studies when a single unit is treated, and there are multiple control units. |
Geographical lift |
Measures the impact of an intervention in a specific geographic area by comparing it to similar areas without the intervention. Commonly used in marketing to assess regional campaigns. |
ANCOVA |
Analysis of Covariance combines ANOVA and regression to control for the effects of one or more quantitative covariates. Used when comparing group means while controlling for other variables. |
Differences in Differences |
Compares the changes in outcomes over time between a treatment group and a control group. Used in observational studies to estimate causal effects by accounting for time trends. |
Staggered Difference-in-Differences |
Estimates event-time treatment effects when different units adopt treatment at different times, using an imputation approach that models untreated outcomes and compares observed outcomes to counterfactual predictions. |
Regression discontinuity |
Identifies causal effects by exploiting a cutoff or threshold in an assignment variable. Used when treatment is assigned based on a threshold value of an observed variable, allowing comparison just above and below the cutoff. |
Regression kink designs |
Focuses on changes in the slope (kinks) of the relationship between variables rather than jumps at cutoff points. Used to identify causal effects when treatment intensity changes at a threshold. |
Interrupted time series |
Analyzes the effect of an intervention by comparing time series data before and after the intervention. Used when data is collected over time and an intervention occurs at a known point, allowing assessment of changes in level or trend. |
Instrumental variable regression |
Addresses endogeneity by using an instrument variable that is correlated with the endogenous explanatory variable but uncorrelated with the error term. Used when explanatory variables are correlated with the error term, providing consistent estimates of causal effects. |
Inverse Propensity Score Weighting |
Weights observations by the inverse of the probability of receiving the treatment. Used in causal inference to create a synthetic sample where the treatment assignment is independent of measured covariates, helping to adjust for confounding variables in observational studies. |
Diagnostics-first by design#
CausalPy emphasizes transparent, uncertainty-aware outputs for rigorous causal analysis:
Effect summaries: Every experiment provides
effect_summary()returning decision-ready statistics with both tabular and prose formatsUncertainty quantification: Bayesian models report HDI (Highest Density Intervals); OLS models report confidence intervals
Practical significance: ROPE (Region of Practical Equivalence) analysis to assess whether effects exceed meaningful thresholds
Direction testing: Tail probabilities (e.g., P(effect > 0)) for directional inference
How CausalPy compares#
The Python causal inference ecosystem has several strong packages, each with different strengths. Here’s how CausalPy fits in:
CausalPy |
CausalImpact |
DoWhy |
CausalML |
pyfixest |
|
|---|---|---|---|---|---|
Primary focus |
Quasi-experimental causal effect estimation |
Time series impact analysis (BSTS) |
End-to-end causal reasoning pipeline (graph → identify → estimate → refute) |
Uplift modeling and heterogeneous treatment effects (CATE/ITE) |
High-dimensional fixed effects regression (econometrics) |
Bayesian estimation |
First-class via PyMC, with full posterior distributions and HDI |
Yes — Bayesian Structural Time Series |
Limited — primarily frequentist estimators |
No |
No |
Uncertainty quantification |
Credible intervals (HDI), ROPE analysis, tail probabilities |
Posterior credible intervals |
Confidence intervals, refutation tests |
Confidence intervals |
Cluster-robust and heteroscedasticity-robust standard errors |
Synthetic control |
Yes — Bayesian weighted |
Yes |
No |
No |
No |
Difference-in-differences |
Yes — including staggered adoption |
No |
Yes — as one of many estimators |
No |
Yes — TWFE, Did2s, Sun-Abraham |
Regression discontinuity |
Yes — Bayesian and OLS |
No |
No |
No |
No |
Interrupted time series |
Yes |
Yes |
No |
No |
No |
Causal discovery |
No — use causal-learn or DoWhy-GCM |
No |
Yes — via DoWhy-GCM extension |
No |
No |
Uplift / CATE modeling |
No — use CausalML or EconML |
No |
Yes — via EconML integration |
Yes — primary focus |
No |
Best for |
Teams that need uncertainty-aware estimates from a quasi-experimental design |
Rapid impact analysis of a single time series using synthetic control |
Projects that require formal identification and robustness testing across a causal DAG |
A/B test personalization, targeting optimization, CATE estimation |
Fast econometric regressions with many fixed effects |
When to choose CausalPy#
CausalPy is the right choice when you have a plausible quasi-experimental design — a policy change, a geo-targeted campaign, a threshold rule — and you want Bayesian uncertainty quantification over the causal effect. If you need to reason about causal graphs and formal identification strategies, start with DoWhy. If you need heterogeneous treatment effects from A/B tests, look at CausalML. If you need fast fixed-effects regressions at scale, pyfixest is purpose-built for that.
CausalPy complements these packages rather than replacing them. Many teams use DoWhy for identification and CausalPy for estimation, or pyfixest for initial exploration and CausalPy for Bayesian analysis with full uncertainty.
Citing CausalPy#
If you use CausalPy in your research, please cite it. A Zenodo DOI for stable releases is planned. In the meantime, you can cite the repository:
@software{causalpy,
  author = {{PyMC Labs}},
  title = {CausalPy: Causal inference for quasi-experiments in Python},
  url = {https://github.com/pymc-labs/CausalPy},
  year = {2026}
}
Roadmap#
Plans for the repository can be seen in the Issues.
License#
Thanks to our contributors#

The contributor image is regenerated weekly by a GitHub Actions workflow (.github/workflows/contributors.yml) that opens a PR when the contributor list changes.